Night Lights
The map at night: every glacier a light that changes colour, with a score generated from the data.
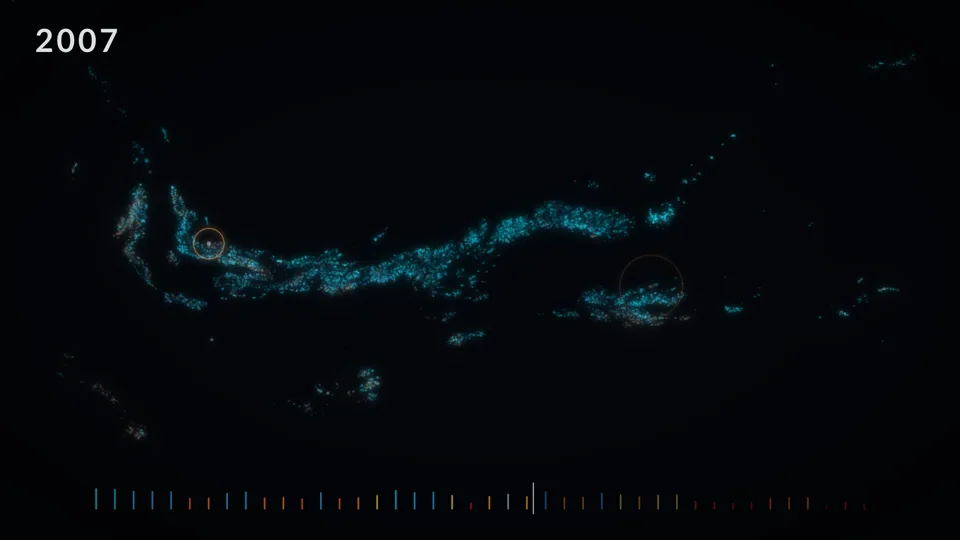
The full-length video is not published yet. This loop is a four-second excerpt.
What it shows
The map of western North America at night, from 1984 to 2025. Each glacier is a light on a dark ground, from cyan (snowy) to red (almost no snow left), and the music changes with them. When a glacier stays under 10% of snow for two years, it plays a crystalline note where it sits and a warm ring opens on the map. A pulse starts in 1996 and speeds up as regions drift apart. The strip at the bottom shows the average snow over 42 years.
Data
For each glacier and each year, the share of its surface covered by snow, from 0% to 100%, measured on satellite images. The map is projected and turned so that it fills the width of the screen, north-west on the left.
How it is made
The sound script writes the list of events (when, where) and the video replays it to draw the rings, so image and sound cannot drift apart.
Sound
The map is cut into 15 regions, and each one is a voice in a pad. It sounds higher for the north, is placed left to right like the region, and is richer when the region has a lot of snow and more out of tune when it has little. The chords go from major to minor and sink as snow is lost, in three movements, then end on a bare fifth.
© 2026 Maxime Tarka, all rights reserved. Made from the dataset on Zenodo, doi 10.5281/zenodo.22311126. Dataset on Zenodo.