Wave
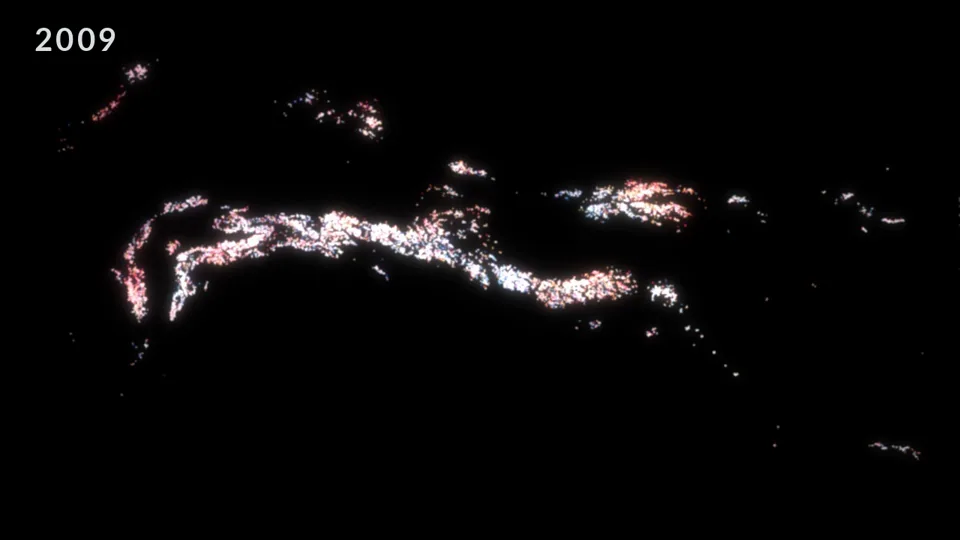
A wave of light across the map, one glacier at a time.
The full-length video is not published yet. This loop is a four-second excerpt.
What it shows
A wave of light crossing the map, one glacier at a time. Each glacier has its own fixed moment in the year. When it comes, it lights up red if its snow line climbed and blue if it fell, as brightly as the change is large, then fades back. The year is shown on a counter.
Data
For each glacier and each year, the gap between the position of its snow line (the altitude above which snow stays) and its usual position. Map projected and turned as in Night Lights.
How it is made
Each glacier is a point of light on a black canvas with a soft halo.
Sound
Each year, 16 soft marimba notes, each standing for the glaciers that light up at that moment. The higher their snow line, the lower the note, and a big change makes it longer and richer. Its position from left to right follows longitude, and a slow pad follows the year’s median.
© 2026 Maxime Tarka, all rights reserved. Made from the dataset on Zenodo, doi 10.5281/zenodo.22311126. Dataset on Zenodo.